
If you use GitHub Copilot in VS Code, you’re making Large Language Model (LLM) calls every time you send a chat message, accept an inline suggestion, or trigger an agent action. Each call sends tokens – words or word fragments – to the model, generating a cost measured in AI Credits (AIC). VS Code records the full breakdown for every single one of these interactions. You just have to know where to look – and how to read it.
In this post, I’ll walk through one real log entry, explain what each field means, and show you how the token counts translate into the AIC total so you can decode your own usage.
Where the cost data lives
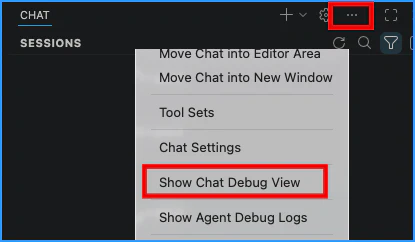
Every model call that Copilot makes gets logged with detailed usage information. You can find these entries in the Copilot Chat Debug View. To open it, click the ... overflow menu in the top-right corner of the Chat view and choose Show Chat Debug View:
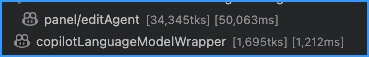
Details about the tokens show up as part of the request/response calls. You’ll see them labeled with internal Copilot request type names like panel/editAgent and copilotLanguageModelWrapper.
Here’s a sample of a request made to Claude Sonnet 4.6:
 1requestType      : ChatMessages
 2model            : claude-sonnet-4.6
 3maxPromptTokens  : 167997
 4maxResponseTokens: 32000
 5otherOptions     : {"stream":true}
 6duration         : 4385ms
 7timeToFirstToken : 4193ms
 8resolved model   : claude-sonnet-4-6
 9usage            : {"prompt_tokens":45882,"completion_tokens":210,
10                    "total_tokens":46092, ... }
11copilotUsage    : 1.94 AIC (1943925000 nano-AIU)
That last line – 1.94 AIC – is the bottom line. But where does that number come from?
Understanding the token accounting
The key to understanding the cost breakdown for the tokens is understanding what these blocks mean. Let’s start with the usage block, since that gives you one view of the story. The first part of this example looks like this:
 1"prompt_tokens":45882,
 2"completion_tokens":210,
 3"total_tokens":46092,
 4"prompt_tokens_details":{
 5  "cached_tokens":45150,
 6   "cache_creation_input_tokens":731,
 7   "anthropic_cache_creation":{
 8     "ephemeral_1h_input_tokens":0,
 9     "ephemeral_5m_input_tokens":731
10   }
11},
12"completion_tokens_details":{
13  "reasoning_tokens":0,
14  "accepted_prediction_tokens":0,
15  "rejected_prediction_tokens":0
16},
There are a few key parts:
prompt_tokens(45,882)- The total number of “request” tokens sent to the model as input. This includes your message, system instructions, file context, and any cached content.
completion_tokens(210)- The “response” tokens the model generated in its response back to you. These are the most expensive tokens.
cached_tokens(45,150)- Tokens from the prompt that were already in the provider’s read cache from an earlier request. These are typically 10% of the cost of regular input tokens because the model doesn’t have to reprocess them.
cache_creation_input_tokens(731)- Tokens that were written into the cache during this request to support potential reuse in future requests. The
ephemeral_5m_input_tokensfield confirms these were all written with a 5-minute cache window; if the cache isn’t reused within that window, it expires and the tokens are cleaned up.
The “input tokens” – the tokens that are not cached – are hidden in those numbers. The prompt_tokens value is the combined total of fresh input, cache reads, and cache writes, so you need to subtract the cached portions to isolate the new input tokens. Doing the math: 45,882 (prompt) − 45,150 (cache read) − 731 (cache write) = 1 input token.
In this example, most of the prompt’s input tokens are being processed from the cache. That’s a good thing. You’ll see how that helps to reduce the AIC cost in a moment.
From model pricing to AIC rates
To understand the cost, you need to know how model pricing maps to AICs. To begin with, 1 AIC is equivalent to $0.01 (USD). Each AIC splits into 1,000,000,000 (1 billion) nano-AIU, which is what the log uses internally to track very small costs precisely. You’ll notice that generally speaking, Copilot translates the published AIC costs directly from the model costs. Anthropic publishes Claude Sonnet’s rates. The details are provided per “MTok” (per million tokens). As of this post, the price for Claude Sonnet looks like this:
| Token type | USD per MTok | AIC per MTok |
|---|---|---|
| Input | $3.00 | 300 |
| Output | $15.00 | 1,500 |
| Cache write (5m) | $3.75 | 375 |
| Cache read | $0.30 | 30 |
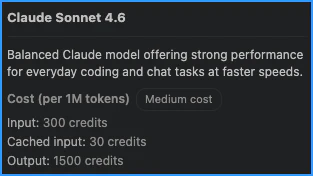
The conversion is straightforward: multiply the USD amount by 100 to get the AIC rate (for example, $3.00 × 100 = 300 AIC). You can also see the rates reflected in VS Code. For example, hovering over Sonnet 4.6 in the model selector shows the same rates:
Now you know where those numbers come from and how they relate to the AICs.
Doing the math by hand
Now you have everything you need. Take the four token counts from the usage block, multiply each by its per-million-token AIC rate, and sum them up:
| Token type | Count | Rate (AIC/MTok) | Cost contribution |
|---|---|---|---|
| Cache read | 45,150 | 30 | 1,354,500 |
| Cache write | 731 | 375 | 274,125 |
| Input | 1 | 300 | 300 |
| Output | 210 | 1,500 | 315,000 |
| Total | 1,943,925 |
Since these are costs per million tokens, you divide the final number by 1 million. The result is 1.943925. Rounded, that’s the same value as copilotUsage: 1.94 AIC.
The shortcut already in the log
You might have noticed the copilot_usage.token_details array buried in the usage block. It contains the exact same information in a different form, with the per-token cost components already prepared for you:
 1"copilot_usage":{
 2  "token_details":[
 3    {"batch_size":1000000, "cost_per_batch":300000000000,
 4     "token_count":1,     "token_type":"input"},
 5    {"batch_size":1000000, "cost_per_batch":30000000000,
 6     "token_count":45150, "token_type":"cache_read"},
 7    {"batch_size":1000000, "cost_per_batch":375000000000,
 8     "token_count":731,   "token_type":"cache_write"},
 9    {"batch_size":1000000, "cost_per_batch":1500000000000,
10     "token_count":210,   "token_type":"output"}
11  ],
12  "total_nano_aiu":1943925000
13}
Each entry tells you everything: the batch_size (1,000,000 tokens), the cost_per_batch (in nano-AIU per batch of tokens), and the token_count. The per-token cost in “nano AI units” is simply cost_per_batch / batch_size. Applying that to each token type:
| Token type | Count | Cost_per_batch / batch_size | Cost (nano-AIU) |
|---|---|---|---|
| cache_read | 45,150 | 30,000 | 1,354,500,000 |
| cache_write | 731 | 375,000 | 274,125,000 |
| input | 1 | 300,000 | 300,000 |
| output | 210 | 1,500,000 | 315,000,000 |
| Total | 1,943,925,000 |
This matches the total_nano_aiu field (1,943,925,000). To convert back to AIC, divide nano-AIUs by 1 billion. You get the same value of 1.94 AIC.
This is valuable because the rates aren’t hardcoded into your tooling. They come from the server with each response, meaning you can always compute costs from the log data alone without maintaining your own price sheet. This also means that if you are using multiple agents and subagents, you can see how much each contributed to the overall cost by looking at their individual log entries.
What the numbers reveal
Looking at this specific request, a few things stand out. The cache read tokens make up the overwhelming majority of the prompt. At the same time, they’re the least expensive line item at 30 AIC/MTok. If those same tokens had been processed as fresh input, they would have cost 10× more! Caching saves significant cost on multi-turn conversations where the system prompt and prior context carry forward between requests. You pay a higher charge for the initial cache write, but subsequent calls will be much cheaper as they hit the cache.
In this case, you can also see previous cache entries in use, so the write cost covers only the new tokens you added to the cache in this request (731 tokens). If those had all been fresh input, the cost would have been much higher. You should know that each cache belongs to a specific model. If you switch models, you’ll need to rebuild the cache for the new model, which increases the cost of the new request.
Output tokens are the most expensive per token – 5× the cost of fresh input and 50× the cost of cache reads. As a result, keeping model responses concise can help manage costs. In this example, the response was only 210 tokens, which is relatively small. If the model had generated a longer response, the cost would have increased significantly.
You get two practical takeaways from this. First, long conversations cost the least when you maximize cache hits and keep model responses concise. The system already optimizes for this – notice how 98% of the prompt tokens here landed in cache. Second, you can lower costs by focusing your requests. For example, if you ask Copilot to review a function for security issues, requesting a one-line verdict like {"result": "success"} costs much less than producing a full paragraph explaining the analysis and why it passed.
What’s next
Every model call in VS Code carries this full breakdown. Once you know how to read it, you can quickly see how the costs are being calculated. You can identify which requests are expensive, understand why, and make informed decisions about how you interact with Copilot.
There’s more detail hiding in those log entries that can help you optimize your usage. In future posts, I’ll dive into those details and how to identify opportunities for cost savings. For now, you can start by exploring your own logs and seeing the cost breakdown in action!