
Observability is important in software development. If you don’t know what’s happening, it can be hard to know where to put your focus for improvement. This can be especially true if you’re hosting your own runners for GitHub Actions. GitHub Actions Runner Controller (ARC) provides a way to manage and automatically scale self-hosted Actions runners using Kubernetes. It’s now the primary way GitHub recommends managing self-hosted runner environments.
One of the great features of ARC is it has built-in support for observability. It exposes many commonly requested metrics, giving you visibility into how the runners are performing and how many jobs are waiting to be processed. Unfortunately, these metrics are not enabled by default. There are instructions for enabling the metrics, but they require you to understand both the Helm charts how Prometheus expects metrics to be exposed. This post will hopefully help to clarify the process.
And before you ask – metrics are not directly exposed by GitHub for hosted runners. There is no metrics endpoint today. If you need the performance details for jobs and runners, you can use a GitHub web hook to listen for these details (aside from the number of jobs waiting to be assigned to runners).
First, you’ll need to understand the tools involved. If you’re already familiar with Helm and Prometheus, you can skip ahead to the section on setting up ARC.
Helm
If you’re not familiar with it, Helm is a sort of package manager for installing applications and features on Kubernetes. Most applications (including ARC) need to setup and configure multiple Kubernetes features, such as service accounts, roles, and custom resource definitions (CRDs). Helm provides a way to bundle all of these together into a single package called a chart. It uses a templating language to allow you to customize the installations. By providing a few values, you can quickly customize an application.
For example, to install the ARC controller in Kubernetes, you can run the following command:
Helm allows you to use the --set argument to override or configure values in the chart (or --set-string for values that must be treated as strings). Alternatively, you can store all of the values in a YAML file; the -f argument can be used to provide the path to the file.
Prometheus and Grafana
Generally, metrics in Kubernetes are exposed using the Prometheus text-based Exposition format. Consequently, many Kubernetes clusters interact with (or include) a Prometheus server for collecting and querying these metrics. Prometheus is an open-source monitoring solution. Fun fact: it was the second project after Kubernetes to join the Cloud Native Computing Foundation. It can “scrape” metrics (read them from exposed web endpoints), store them in a time-series database, and provide a query language for analyzing the data. ARC’s metrics are exposed in this format.
Prometheus is often used in conjunction with Grafana, which provides a way to visualize the data. Both of these tools could be a post (or book) on their own, so I won’t cover them here. If you’re managing a Kubernetes cluster, you’ll definitely want to spend some time understanding these two systems (along with OpenTelemetry, an observability framework that works with Prometheus and other tools). If you’re hosting in the cloud, consider using managed Prometheus and managed Grafana services. It will save you a lot of time and effort!
Setting up ARC
ARC is installed using Helm. That provides an easy way to enable the metrics.
Three steps are required to be able to access and use the metrics:
- Enable the metrics in the Helm chart for the controller
- Configure the controller to enable Prometheus to scrape the metrics
- Configure the listener to enable Prometheus to scrape the metrics
For the first step, we need to provide a few values to the Helm chart for the controller:
When these values are set, the controller and listener will both expose their metrics. After that, we just need to tell Prometheus where to find them.
Configuring Prometheus scraping
The remaining steps require configuring the controller and listener so that Prometheus knows to scrape their metrics. There are a few ways this can be accomplished. One of the easiest is to annotate the pods that expose the metrics. This allows Prometheus to dynamically identify the metrics to be scraped. For the controller, podAnnotations are used to apply the metadata to the pods. For the listeners, the listenerTemplate is needed to apply the annotations.
There are three annotations that are needed:
prometheus.io/scrape- Instructs Prometheus to scrape metrics from the pod. This value must be a string with the value
true.
prometheus.io/path- The path to the metrics endpoint.
prometheus.io/port- The port to use when scraping the pod. This value must be a string.
Depending on how frequently Prometheus is configured to scrape the metrics, it will periodically query the metrics endpoints and store the results. The default is 1 minute. More frequent scraping provides more up-to-date information and alerting support. At the same time, increased scraping puts additional overhead on the Kubernetes nodes.
The Helm commands
Putting this together, we can provide these details during the install (or upgrade) of the ARC components. For example, the controller could be configured like this:
 1helm install arc \
 2    --namespace "arc-systems" \
 3    --create-namespace \
 4    --set metrics.controllerManagerAddr=':8080' \
 5    --set metrics.listenerAddr=':8080' \
 6    --set metrics.listenerEndpoint='/metrics' \
 7    --set-string podAnnotations."prometheus\.io/scrape"=true \
 8    --set-string podAnnotations."prometheus\.io/path"=/metrics \
 9    --set-string podAnnotations."prometheus\.io/port"=8080 \
10    oci://ghcr.io/actions/actions-runner-controller-charts/gha-runner-scale-set-controller
Similarly, the runner scale set can be configured to expose its listener’s metrics:
 1helm install "arc-runner-set" \
 2    --namespace "arc-runners" \
 3    --create-namespace \
 4    --set-string "listenerTemplate.spec.containers[0].name=listener" \
 5    --set-string listenerTemplate.metadata.annotations."prometheus\.io/scrape"=true \
 6    --set-string listenerTemplate.metadata.annotations."prometheus\.io/path"=/metrics \
 7    --set-string listenerTemplate.metadata.annotations."prometheus\.io/port"=8080 \
 8    --set runnerGroup='arc-runners' \
 9    --set githubConfigUrl="https://github.com/myorganization" \
10    --set githubConfigSecret.github_token="$GH_PAT" \
11    oci://ghcr.io/actions/actions-runner-controller-charts/gha-runner-scale-set
There is one catch for runner scale sets. ARC expects that a listenerTemplate will always have a container named listener (even if you are not configuring that container). If you don’t provide this value, the listener will fail to start. If there are no errors on the command line, you can use kubectl to verify the listener and controller are running. The listener will always be in the same namespace as controller.
% kubectl get pods -n arc-systems

NAME                                     READY   STATUS    RESTARTS   AGE
arc-gha-rs-controller-5f8fbf448c-cswgl   1/1     Running   0          36h
arc-runner-set-578c657d-listener         1/1     Running   0          51m
The port-forward feature can be used to validate the metrics are available as well. The following command will make the metrics endpoint for the listener available at http://localhost:9090/metrics, allowing you to explore the metrics in a browser:
kubectl port-forward --namespace arc-systems arc-runner-set-578c657d-listener 9090:8080You can use a similar approach to view the metrics for the controller. Let’s take a quick look at the metrics that ARC makes available and the information they provide.
ARC’s metrics
The controller and listener each provide a different set of metrics. The controller metrics are focused on the ephemeral runner management, while the listener metrics are focused on the performance of the runners and jobs. Details about the metrics can be found in the ARC documentation.
Controller metrics
The controller exposes the following metrics:
- gha_controller_failed_ephemeral_runners
- Runners that failed to start properly, indicating possible problems with the runner image.
- gha_controller_pending_ephemeral_runners
- Runners that are starting and in the process of being configured to run jobs.
- gha_controller_running_ephemeral_runners
- Runners that are available to take jobs or are currently running jobs.
- gha_controller_running_listeners
- A single record for each running listener, providing a count of active listeners.
There are additional metrics published by the controller, but these are actually part of the underlying runtime and not specific to ARC. As a result, those additional metrics are not directly supported by GitHub.
Listener metrics
A listener is created for each runner scale set. The listener exposes the following metrics:
- gha_assigned_jobs
- The number of jobs that have been assigned to the scale set and which meet the criteria for being assigned to a runner in that scale set. This is the backlog of jobs to be processed.
- gha_busy_runners
- The number of runners that are currently running jobs.
- gha_completed_jobs_total
- The total number of completed jobs since the listener started.
- gha_desired_runners
- The number of runners that the scale set is targeting to have running, used for scaling up or down the runners. This value will be between
gha_min_runnersandgha_max_runners.
- gha_idle_runners
- The number of registered runners that are not currently running jobs.
- gha_job_execution_duration_seconds_bucket
- A histogram containing the number of jobs (by workflow, event name, and job name) taking a specific time (in seconds) or less to execute. Currently this contains 46 buckets ranging from
0.01 seconds to 3,600 seconds (plus
+Inf), with each bucket being cumulative (containing the counts for the lower buckets). Very high cardinality.
- gha_job_execution_duration_seconds_count
- The count of duration records (observations), a counter which always increases. This value will always be identical to
gha_job_execution_duration_seconds_bucket{le="+Inf"}, since both are cumulative counts of the total observations.
- gha_job_execution_duration_seconds_sum
- The cumulative sum of the execution duration observations (in seconds).
- gha_job_startup_duration_seconds_bucket
- A histogram containing the number of jobs (by workflow, event name, and job name)taking a specific time (in seconds) or less to startup. Currently this contains 46 buckets from 0.01 seconds to 3,600 seconds (plus
+Inf), with each bucket being cumulative (containing the counts for the lower buckets). Very high cardinality.
- gha_job_startup_duration_seconds_count
- The count of duration records (observations), a counter which always increases. This value will always be identical to
gha_job_startup_duration_seconds_bucket{le="+Inf"}.
- gha_job_startup_duration_seconds_sum
- The cumulative sum of the startup duration observations (in seconds).
- gha_max_runners
- The configured maximum number of runners for the scale set.
- gha_min_runners
- The configured minimum number of runners for the scale set.
- gha_registered_runners
- The number of runners that are currently registered by the scale set for processing jobs. This number decreases as runners are removed from the scale set as they complete their jobs or are scaled down.
- gha_running_jobs
- The number of jobs that have been assigned to a runner and are either running or queued to run.
- gha_started_jobs_total
- The total number of started jobs since the listener started.
Visualizing the metrics
Once you have the metrics flowing into Prometheus, you can build dashboards in Grafana. This requires some understanding of the querying language for Prometheus (PromQL) and the visualization capabilities of Grafana. I won’t cover those topics here, but I’ll show you an example of a Grafana dashboard I created for ARC to give you an idea of what’s possible:
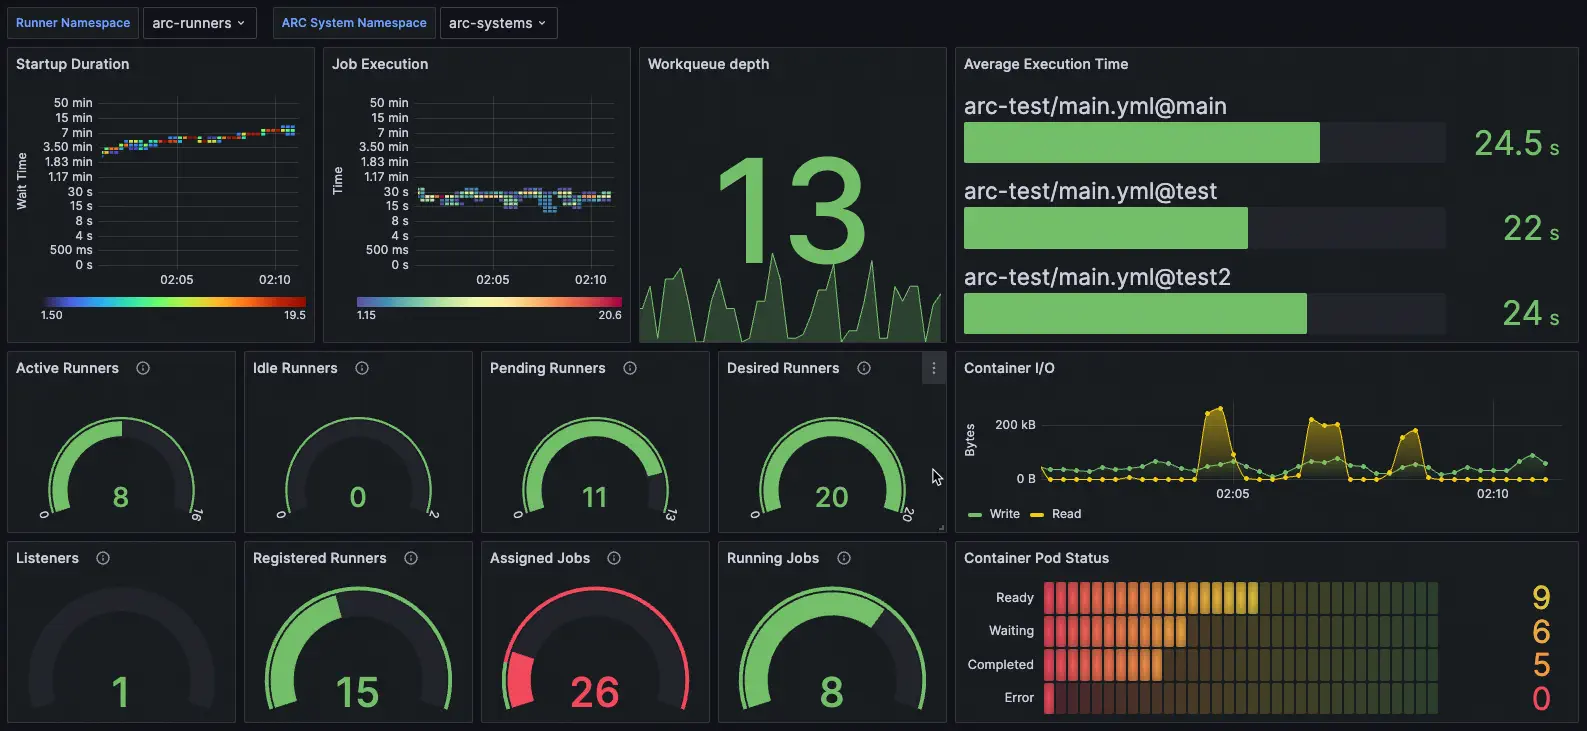
Hopefully, that gives you some idea of what you can do with the metrics and how to get started. As you can see, it’s not too difficult. It just takes a little bit of configuration and you can gain a lot of observability from your self-hosted runners. With just a bit more effort, you can turn those into graphs that support your improvement goals.
I can’t wait to see what you create!